Where do we stand on sea level rise?
A few millimetres. Doesn’t sound too bad, does it? Sea level rise is usually shown in numbers, graphs and projections. But numbers can be tricky. When does 14 mm start to feel like a lot? When your toes get wet? Your feet? Your ankles?
Time to Get Wet Feet takes sea level projections out of the graph, and puts them at our feet. Three photographs turn scientific projections into a human-sized graph, showing the water rising against our ankles over time. Because sea level rise isn’t just about how much, it’s about how fast. Warmer oceans expand, ice melts, and those millimetres keep adding up.
So yes, it looks like we’re going to get wet feet. Fast.
But getting your feet wet also means something else: to stop standing on the sidelines and start doing something. So perhaps these graphs aren’t just showing us how wet our feet will get. They’re an invitation to start doing something; It’s time to get our feet wet.

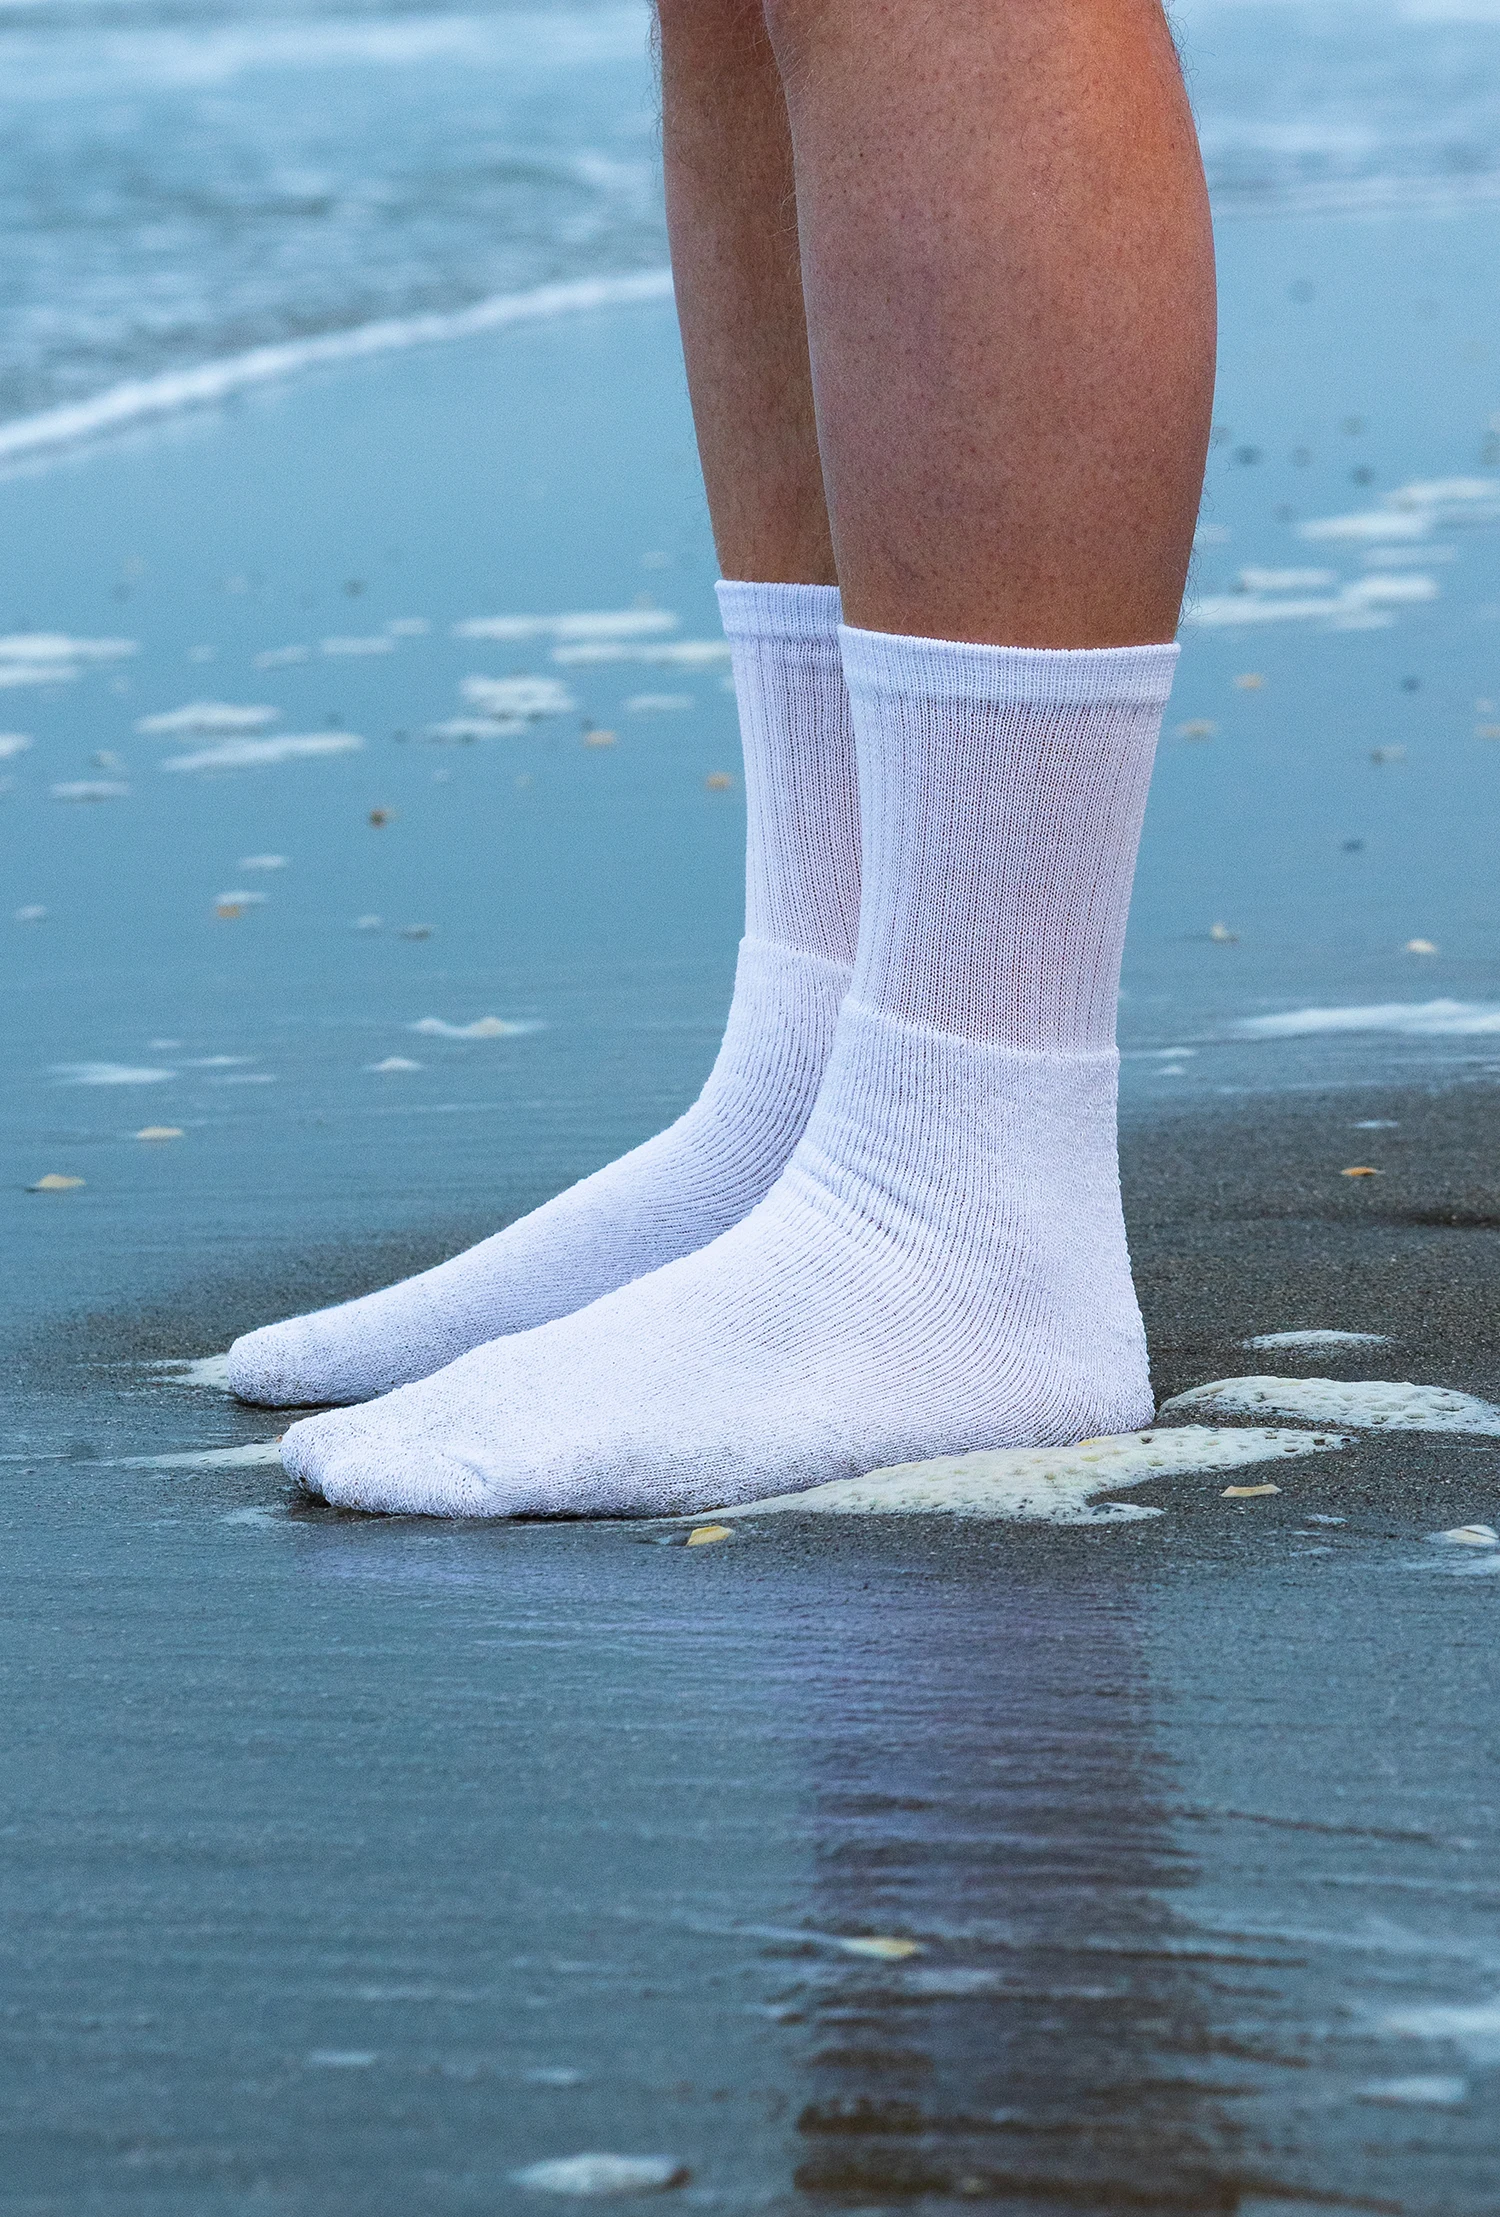
Starting to get wet feet
Today (2025): 0 mm
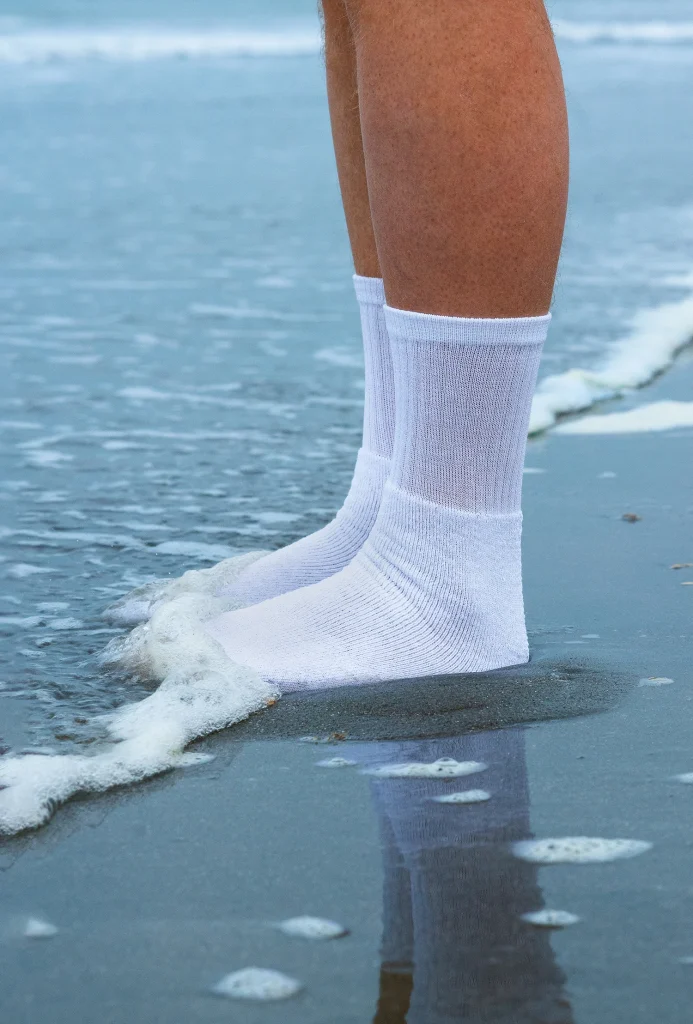
Up to our toes
2027: 14 mm

Up to our ankles
2033: 33 mm


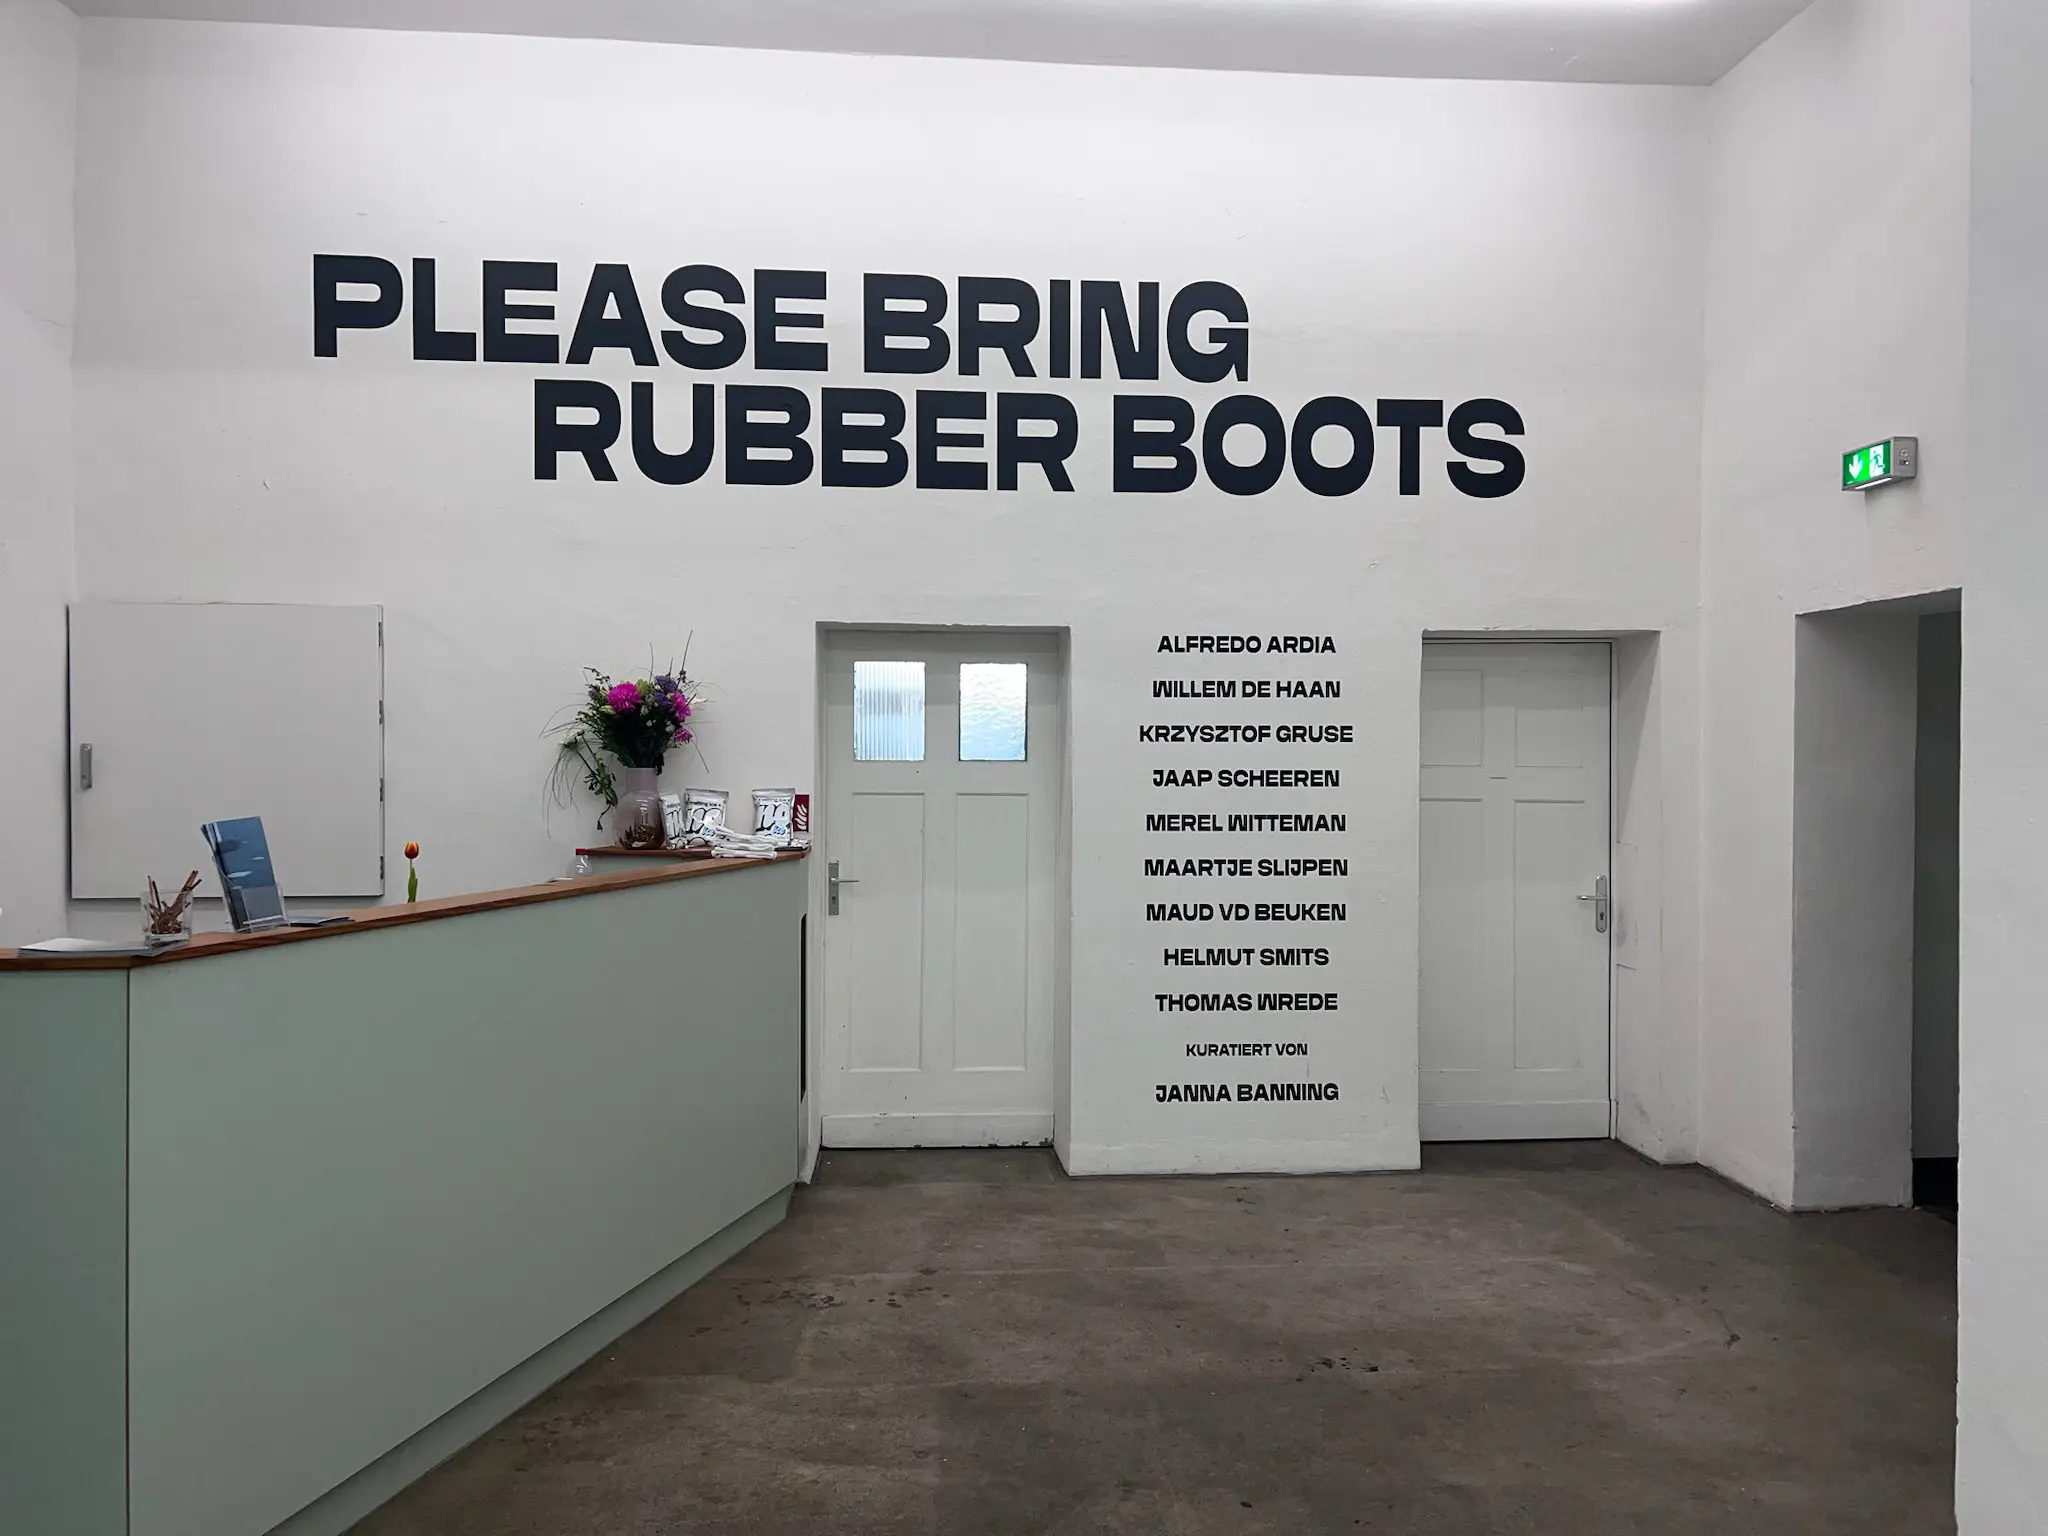
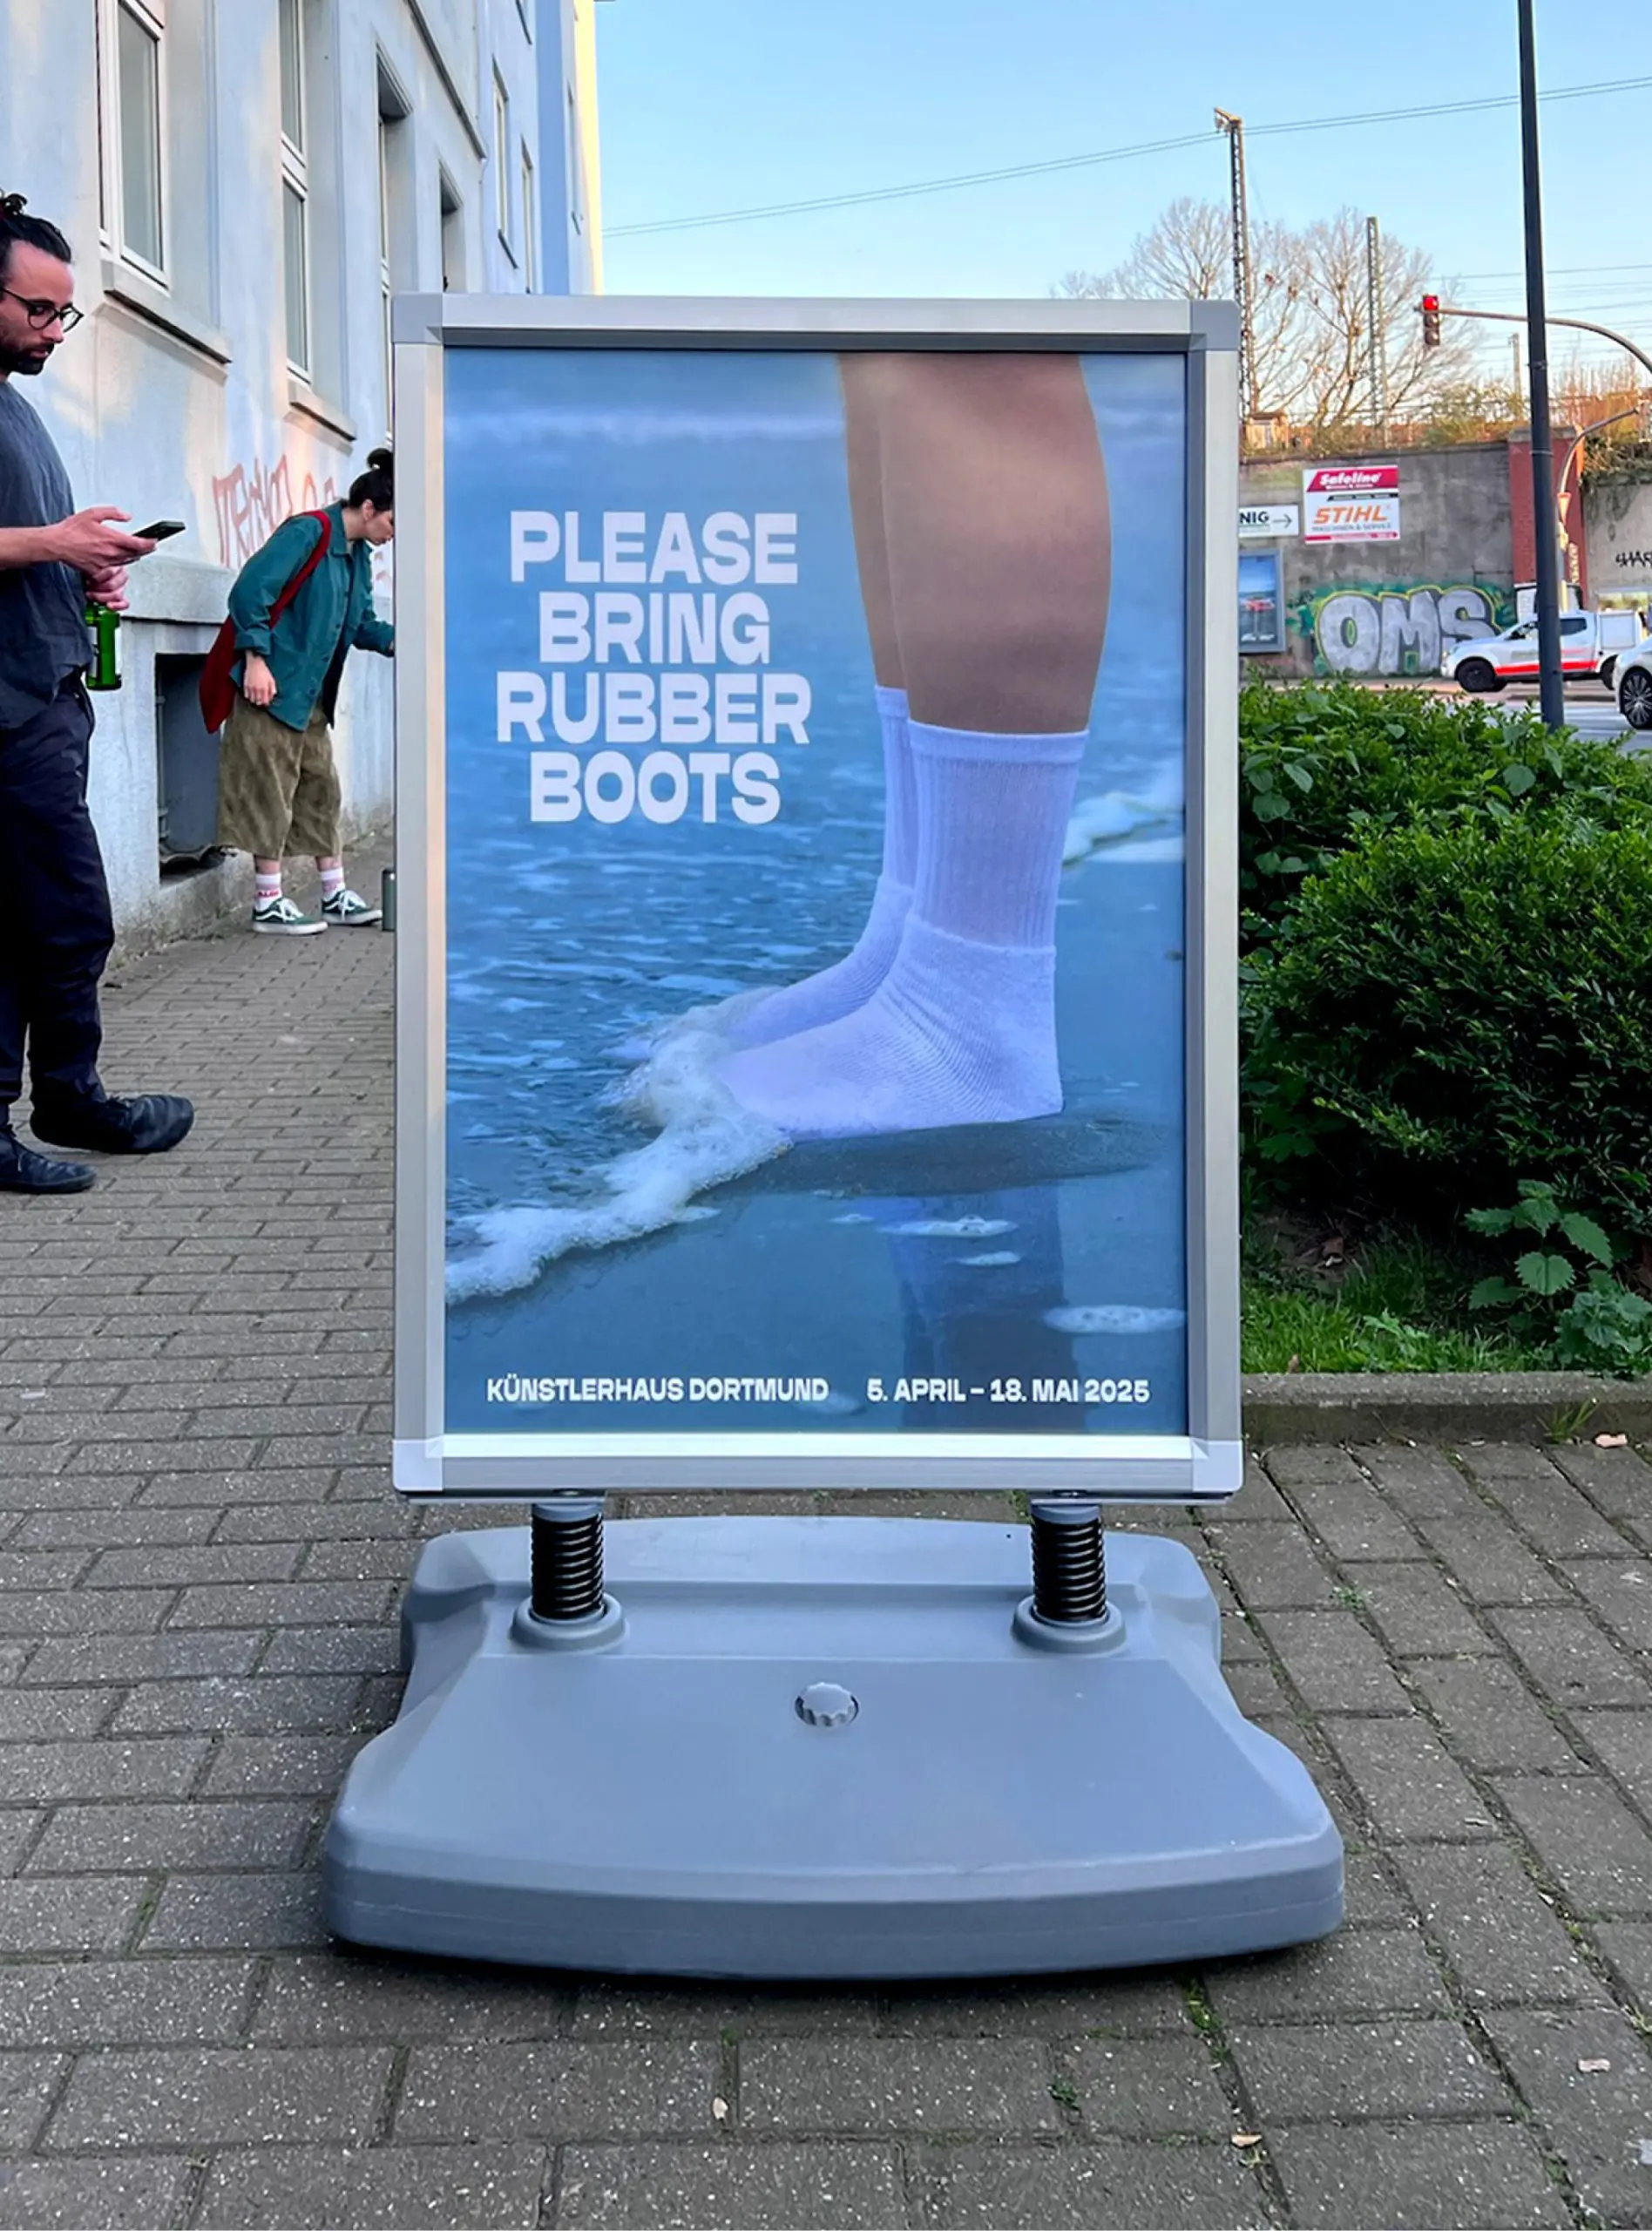
Please bring rubber boots
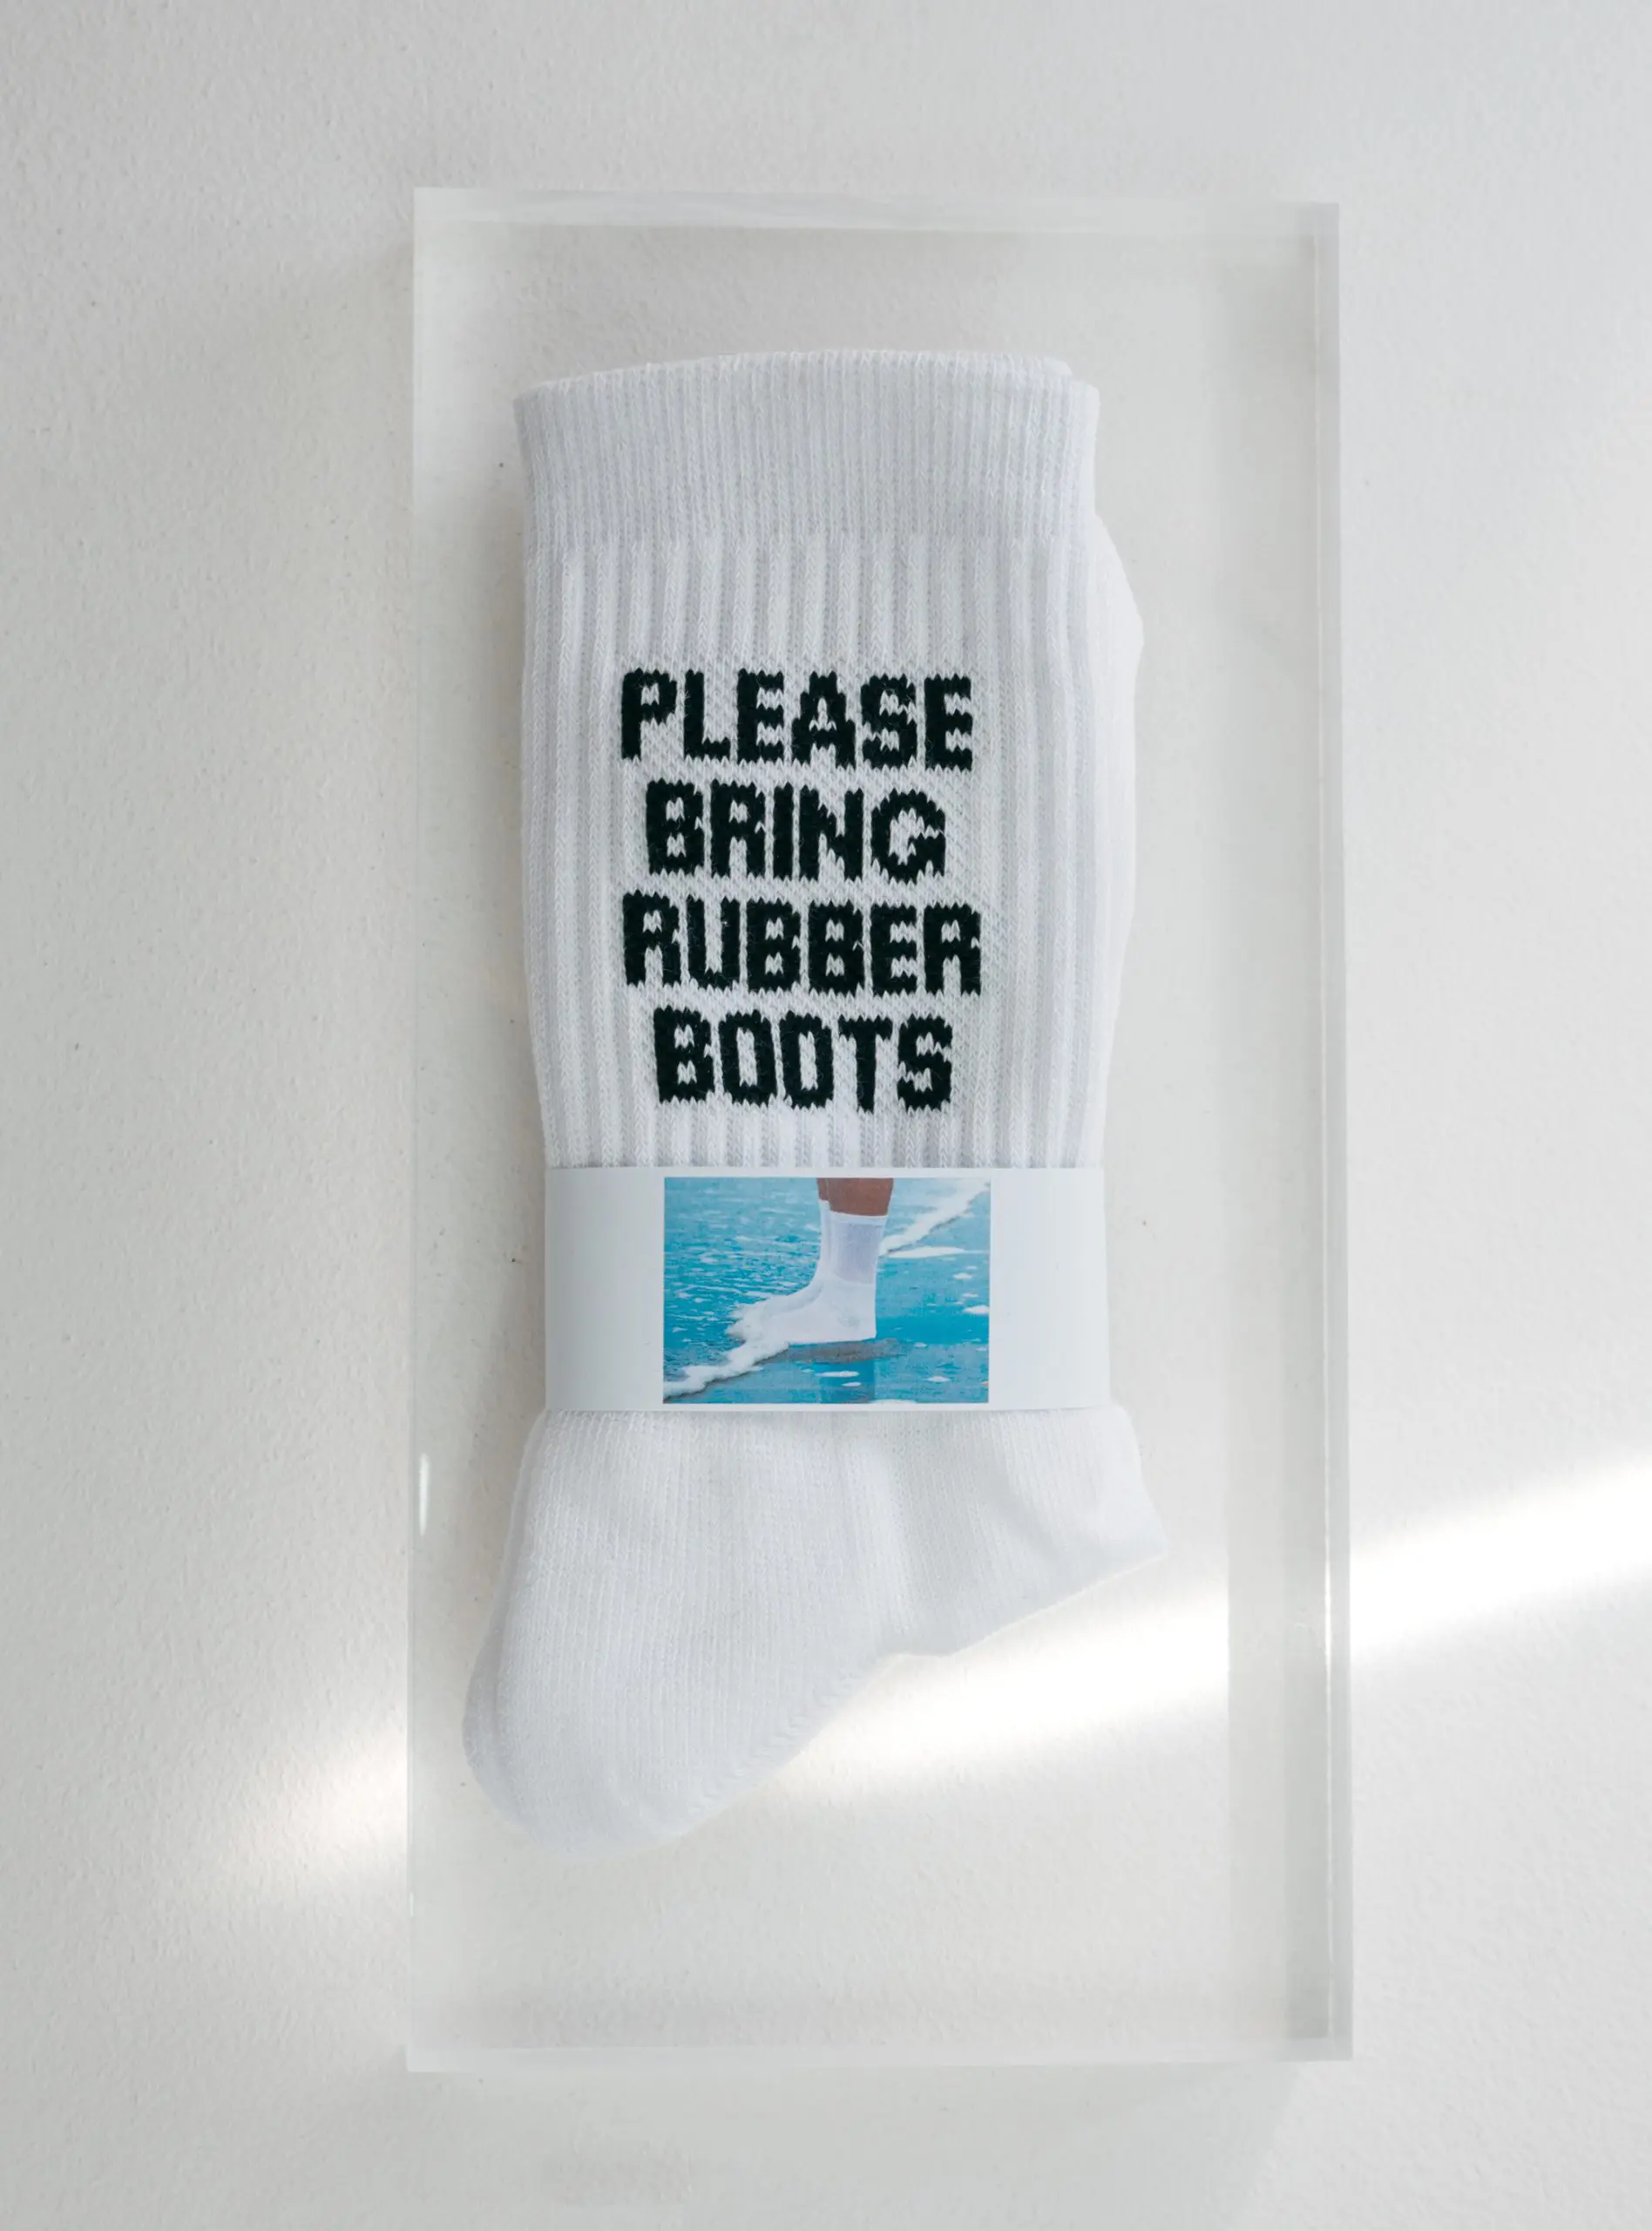
The series was exhibited at the exhibition Please Bring Rubber Boots in Kunstlerhaus Dortmund. One of the photo’s and a video from the series was used for all communication and promotion materials.


Credits
Concept & execution: Merel Witteman & Maartje Slijpen (photo, video and communication of exhibition)
Made in the context of: Exhibition Please Bring Rubber Boots, Dortmund (2025).